About Struct2Net
Struct2Net is a server for structure-based computational predictions of protein-protein interactions (PPIs). Each prediction is also assigned a score, indicating the confidence in that prediction. The predictions here may be used for proteins not well-covered by experimental PPI datasets or used to shortlist the set of potential interactions to be experimentally validated. Alternatively, it can be used as a genome-scale data source that is independent of most functional genomic data and can be integrated with the latter (e.g. co-expression, co-localization, GO description).
How it worksGiven two protein sequences, the structure-based interaction prediction technique threads these two sequences to all the protein complexes in the PDB and then chooses the best potential match. Based on this match, the method generates alignment scores, z-scores, and an interfacial energy for the sequence pair. Logistic regression is then used to evaluate whether a set of scores corresponds to an interaction or not. The algorithm is also extended to find all potential partners given a single protein sequence. Further details about the method are described here.
Why should I care about predicted PPIs? In particular, why should I use your predictions?There has been significant interest for the systems biology community for computationally predicted PPIs, partly because the coverage of experimental PPI data remains relatively noisy and limited. We believe that the structure-based PPI predictions provided by Struct2Net are not available anywhere else. The value of this method, we think, lies in the effort we've put into identifying high-confidence positive and negative examples of PPIs as inputs to machine learning algorithms and the extensive computational effort involved in making each prediction. It is independent of other computational approaches to predicting PPIs. You can use the predictions made here for proteins not well-covered by experimental PPI datasets. Alternatively, you can combine these predictions with your own predictions (using, say, gene co-expression) to achieve better sensitivity and specificity.
About the confidence score thresholdThe minimum score threshold for inclusion of a PPI in our database corresponded to roughly 80% specificity on the test set. We believe a lower specificity than this would not be useful. You can choose an even higher threshold, to further increase specificity (i.e., reduce false positives). We suggest two ways to choose such a threshold. One is to aim for a certain degree of sensitivity and specificity. The file here describes sensitivity and specificity as a function of the chosen threshold for the test set. For human PPIs, we suggest choosing a higher threshold than for yeast or fly. The reason is that human proteins are over-represented in PDB and since our approach uses templates based on these structures, our scores for human PPIs are typically somewhat better.
The second way to choose a threshold would be to start with the total number of PPIs you expect to see for the species. You can use the number of experimentally known PPIs to calibrate your assumption (roughly, 49000 for yeast, 23000 for fly and 27000 for human). Then, using the tables in this file, you can choose a threshold that's likely to give you the expected number of PPIs.
Evaluation of the Prediction Algorithm
Given a pair of proteins, the first stage of our algorithm uses a structure-based threading approach to compute a set of numbers that express the quality of the putative complex structure formed by the two proteins' interaction. The second stage of the algorithm uses logistic regression to integrate these various measures and compute a single score (between 0 and 1). A score of 0 indicates minimal confidence in the possibility of an interaction between the two proteins while a score of 1 indicates maximum confidence. Below, we describe the training of the logistic regression predictor and its evaluation. We emphasize here that the training and test datasets used for training and evaluating, respectively, our machine learning model are completely disjoint; we did not use cross-validation.
Construction of the Training and Test Datasets
We first discuss the construction of the training and test datasets. In the webserver, we've specially marked any output row that was part of the training or test datasets. Our criteria for constructing positive and negative datasets were guided by the following intuitions:
Certain kinds of experiments are more reliable than others (e.g. co-crystallization experiments are likely more reliable than Yeast Two-Hybrid experiments)
Data from a paper publishing a very small number of datapoints is likely to be better validated than data from a paper with hundreds or thousands of observations, and
Previous research on the clustering characteristics of PPI networks has suggested that if protein pairs (A,B) and (B,C) are known to interact, then it is likely that the proteins A and C also interact. We encode these intuitions as per the following criteria:
Positive dataset
We aimed to identify the class of high-confidence, low-throughput experiments in the BioGRID database. For this, we excluded experiments like Affinity Capture, Two-Hybrid, and those based on Phenotypic activation/suppression or Synthetic interaction. That left this set of experiments. Typically, there were only a few interactions per publication for these experiments, further suggesting that these are low-throughput experiments. We included all interactions from these experiments.
We also included all interactions from papers where the published dataset has 5 or less reported PPIs. The intuition here is the reported PPIs will be better validated in such papers than in papers with much larger-scale scans.
Additionally, we included all reported PPIs such that the interacting pair (A,B) was connected by another protein C as well, i.e., there also existed PPIs (A,C) and (B,C) .
Negative Dataset
In literature, it is difficult to find conclusive experimental data that some pair of proteins do not interact. Much of the previous work in PPI prediction has constructed negative training/test sets by using random pairs of proteins (and excluding those with a known interaction). The argument here is that the likelihood of interaction of a random pair of proteins is very small so it is reasonable to treat a random pair as a negative example of PPI. We chose a stricter version of this approach: we required the chosen (randomly selected) pair of proteins to either be disconnected in the experimentally-determined PPI network or be at least 3 hops away from each other in it. Essentially, we require that the two proteins not be co-clustered in the PPI network.
We summarize the size of the training and test sets below:
| Count | Training | Test |
| Positive | 9770 | 2445 |
| Negative | 52749 | 13190 |
Evaluation
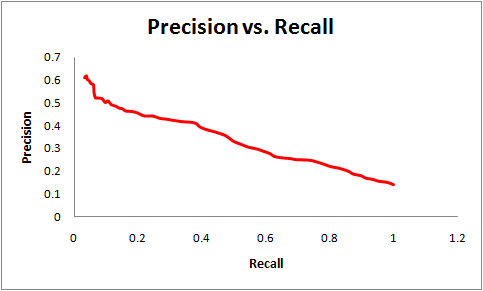
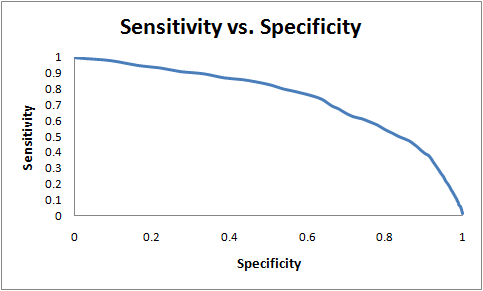
The prediction algorithm can achieve 60% sensitivity while maintaining 75% specificity as measured on the test set. Here, sensitivity = (true positives)/ (true positives + false negatives) and specificity = (true negatives)/ (true negatives + false positives). This compares favorably with other structure-based approaches. For example, at a specificity of 80%, the prediction approach proposed by Lu, Lu and Skolnick achieves a sensitivity of 20% while Struct2Net achieves 80% specificity with 40% sensitivity. The use of threading (as compared to homology modeling) helps improve the quality and coverage of the algorithm. For example, HOMCOS is reported to achieve a recall of 80% with a precision of about 10%. Struct2Net achieves a recall of 80% with a precision of 30%. Here, recall = (true positives)/(true positives + false negatives) and precision = (true positives)/(true positives + false positives).In the graphs below, we show the sensitivity-vs-specificity and precision-vs-recall curves for the STRUCT2NET classification:
| Questions or comments? Please contact struct2net@csail.mit.edu |